Add OpenTelemetry to a Node.js server
Observability (O11y) and especially tracing are great tools to monitor applications and spot issues, particularly on the performance side
OpenTelemetry
According to the official website :
OpenTelemetry is an open source observability framework for cloud native software. It provides a single set of APIs, libraries, agents, and collector services to capture distributed traces and metrics from your application.
OpenTelemetry builds upon years of experience from the OpenTracing and OpenCensus projects, combined with best-of-breed ideas and practices from the community.
What we'll do
First, we'll declare a very simple server and then, we'll add instrumentation in order to visualize the traces in Jaeger, that we'll run locally using Docker.
Declaring the server
This is a very simple server target made with libmodulor. Check out the Playground example for more details.
[🔖 src/index.ts]
import { ServerBooter } from 'libmodulor';

import container from './container.js';

await container.get(ServerBooter).exec({
    srcImporter: (path) => import(path),
});
We could also declare a very simple Node.js server, with explicit express or hono if we don't want to use libmodulor. But we wouldn't get the "business oriented" traces out of the box (see below).
Adding instrumentation
First, let's add all the @opentelemetry/* dependencies we need :
pnpm add @opentelemetry/api \
    @opentelemetry/auto-instrumentations-node \
    @opentelemetry/exporter-trace-otlp-http \
    @opentelemetry/resources \
    @opentelemetry/sdk-node \
    @opentelemetry/semantic-conventions
OpenTelemetry is very granular in terms of packages. It's not very practical in terms of management but at least, we fetch only what we need.
Now, let's declare the instrumentation file.
[🔖 src/instrumentation.ts]
import { DiagConsoleLogger, DiagLogLevel, diag } from '@opentelemetry/api';
import { getNodeAutoInstrumentations } from '@opentelemetry/auto-instrumentations-node';
import { OTLPTraceExporter } from '@opentelemetry/exporter-trace-otlp-http';
import {
    defaultResource,
    resourceFromAttributes,
} from '@opentelemetry/resources';
import { NodeSDK, tracing } from '@opentelemetry/sdk-node';
import {
    ATTR_SERVICE_NAME,
    ATTR_SERVICE_VERSION,
} from '@opentelemetry/semantic-conventions';

// libmodulor's auto instrumentation to get "business oriented" traces out of the box
import { InstrumentationOTL } from 'libmodulor/instrumentation-otl';

const EXPORTER_TYPES = ['console', 'otlp'] as const;
type ExporterType = (typeof EXPORTER_TYPES)[number];

// Using 'otlp' to send the traces to Jaeger instead of just printing them in the console
const EXPORTER_TYPE: ExporterType = 'otlp';
const SERVICE_NAME = 'MyServer';
const SERVICE_VERSION = '0.1.0';
// Jaeger local with : docker run -p 4317:4317 -p 4318:4318 -p 16686:16686 jaegertracing/jaeger:2.19.0
const OTLP_EXPORTER_URL = 'http://localhost:4318/v1/traces';

// We can set the level to DiagLogLevel.ALL to have all the debug information if need be
diag.setLogger(new DiagConsoleLogger(), DiagLogLevel.INFO);

// The resource attributes will be available in all the traces, making filtering very easy
const resource = defaultResource().merge(
    resourceFromAttributes({
        [ATTR_SERVICE_NAME]: SERVICE_NAME,
        [ATTR_SERVICE_VERSION]: SERVICE_VERSION,
    }),
);

let traceExporter!: tracing.SpanExporter;
switch (EXPORTER_TYPE) {
    // @ts-expect-error
    case 'console':
        traceExporter = new tracing.ConsoleSpanExporter();
        break;
    case 'otlp':
        traceExporter = new OTLPTraceExporter({
            url: OTLP_EXPORTER_URL,
        });
        break;
    default:
        EXPORTER_TYPE satisfies never;
}

const sdk = new NodeSDK({
    instrumentations: [
        // This auto instruments most of the Node's primitives as well as other known packages (e.g. express, redis, knex, etc.)
        getNodeAutoInstrumentations(),
        // This auto instruments libmodulor's primitives so we can precisely trace the calls made by a use case
        new InstrumentationOTL({}),
    ],
    resource,
    traceExporter,
});

sdk.start();
Let's now import this file in index.ts. It's very important to put this at the beginning of the file.
import './instrumentation.js'; // <<= Add this line

import { ServerBooter } from 'libmodulor';

import container from './container.js';

await container.get(ServerBooter).exec({
    srcImporter: (path) => import(path),
});
Running the server
Everything is now ready to run the server.
node index.jsThis command would work. Alternatively, we could avoid importing instrumentation.js in index.ts and do like so instead :
node --import instrumentation.js index.jsIn both cases, it would work... partially. Indeed, every ESM library wouldn't get patched. Only the CommonJS ones would be.
Since libmodulor is full ESM and so are most of the recent libraries, we need to make Node.js load them first.
In lots of online resources, we can see something like this :
node --experimental-loader=@opentelemetry/instrumentation/hook.mjs index.jsHowever, in recent Node.js versions, --experimental-loader has been deprecated, and we see the following warning in the logs :
(node:55972) ExperimentalWarning: `--experimental-loader` may be removed in the future; instead use `register()`:
--import 'data:text/javascript,import { register } from "node:module"; import { pathToFileURL } from "node:url"; register("%40opentelemetry/instrumentation/hook.mjs", pathToFileURL("./"));'
(Use `node --trace-warnings ...` to show where the warning was created)
Although it's a little bit verbose, let's update our run command :
node --import 'data:text/javascript,import { register } from \"node:module\"; import { pathToFileURL } from \"node:url\"; register(\"%40opentelemetry/instrumentation/hook.mjs\", pathToFileURL(\"./\"));' index.jsLet's start Jaeger :
docker run -p 4317:4317 -p 4318:4318 -p 16686:16686 jaegertracing/jaeger:2.19.0Let's start hitting some endpoints of our server via curl, the web interface or anything else.
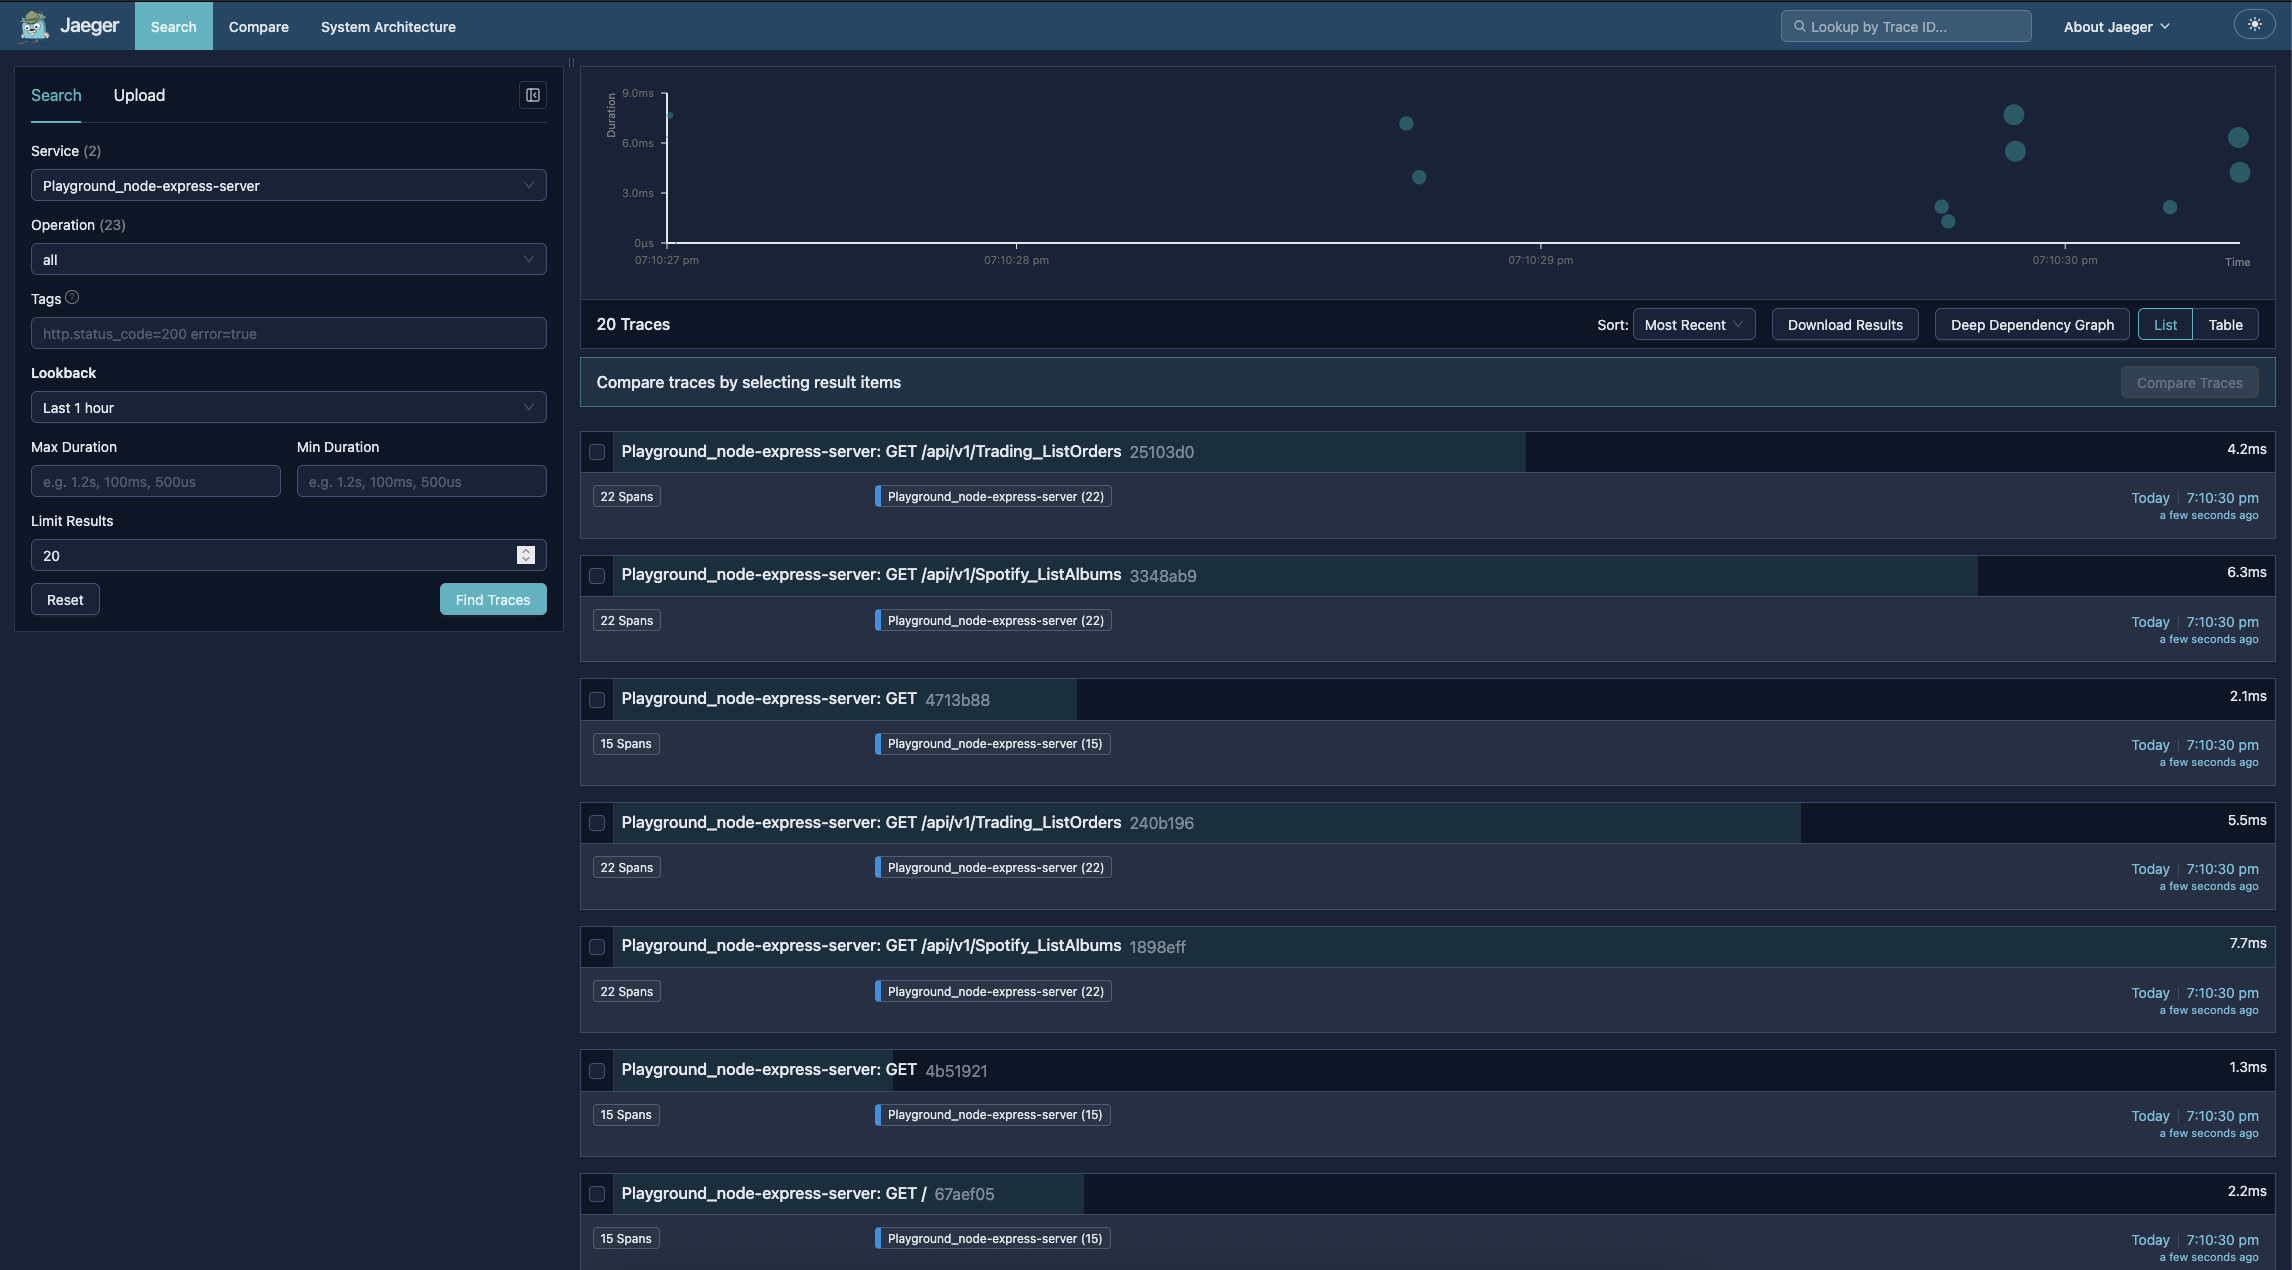
Let's open Jaeger at http://localhost:16686.
We should see traces incoming at each request.
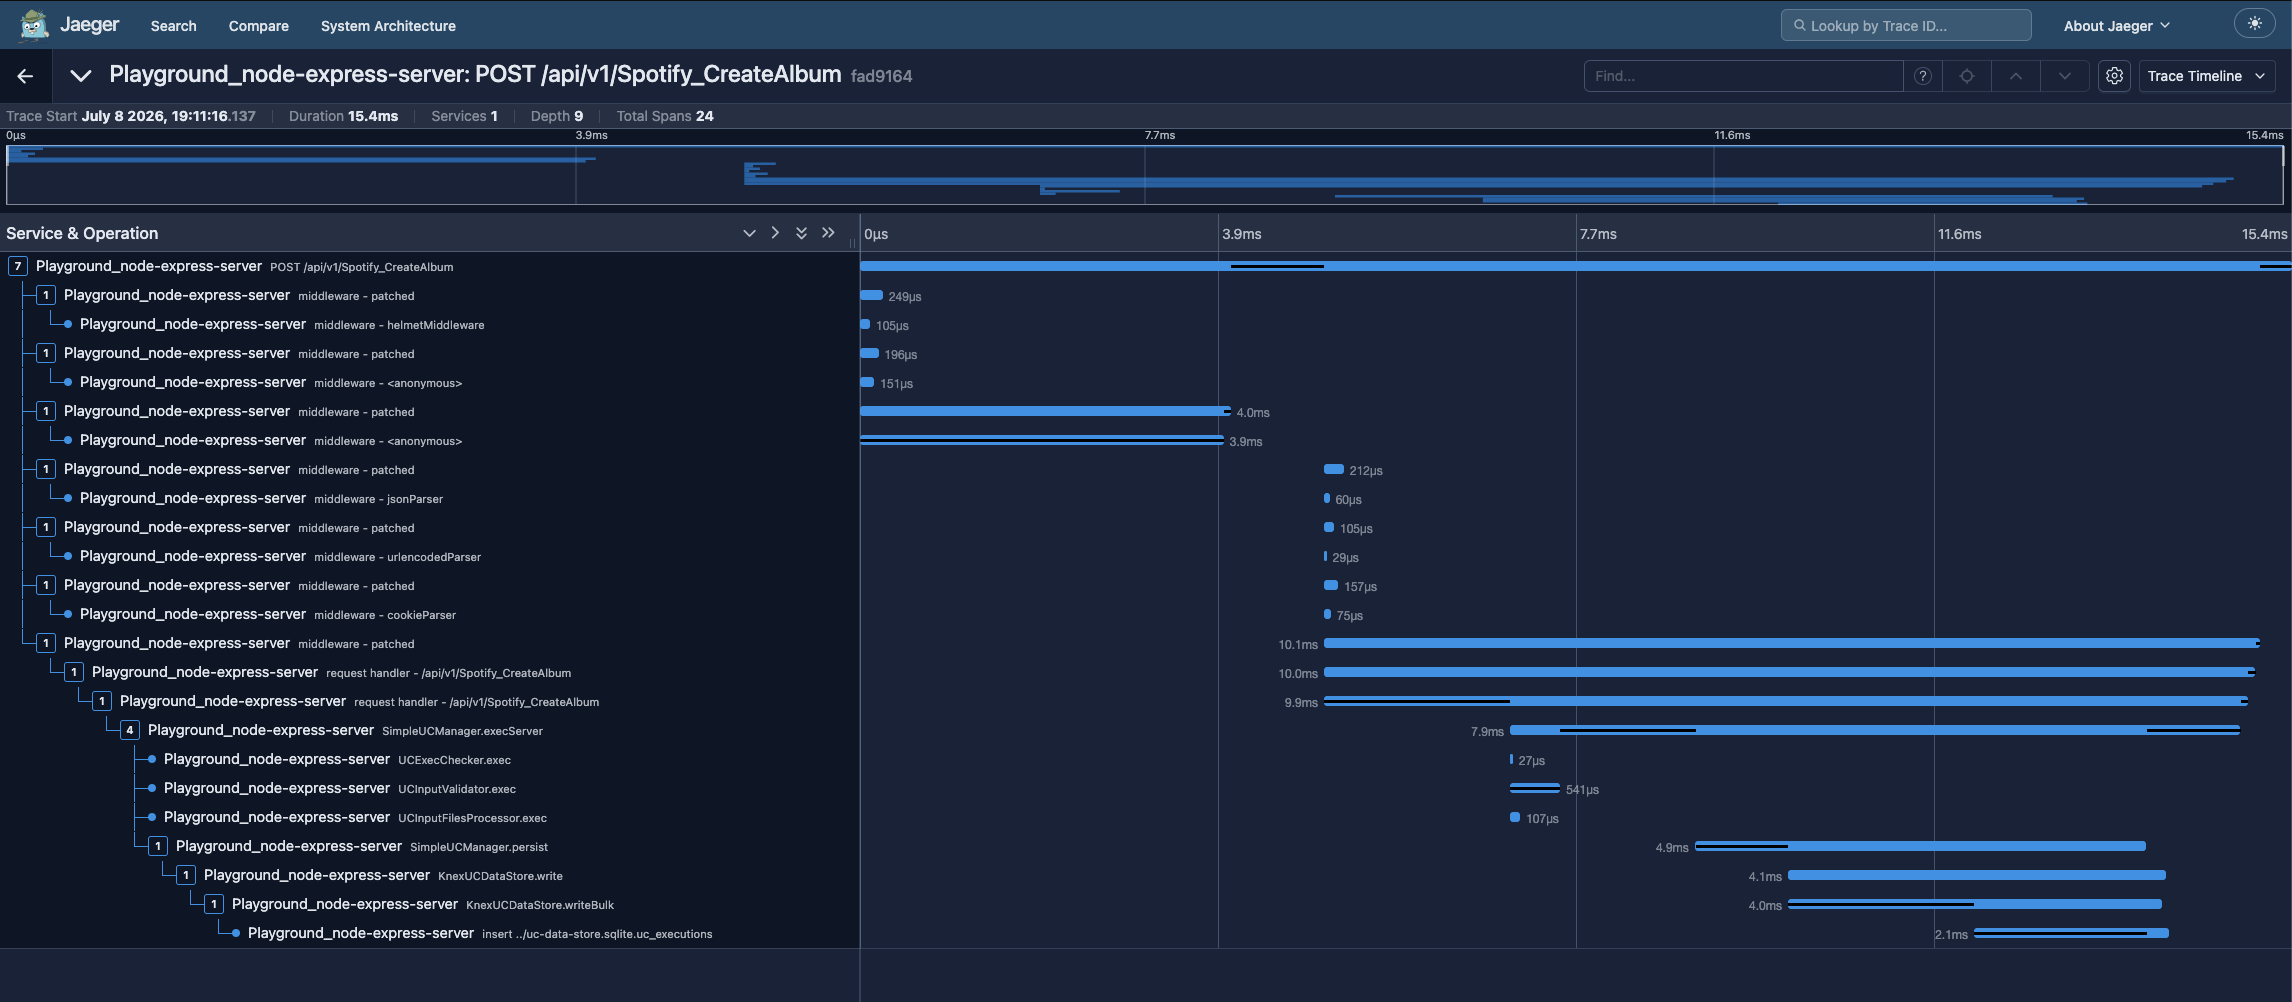
In the screenshot below, we can see all the traces involved when we trigger a Create use case :
- Express entrypoint
- Express middlewares
libmodulormanagers
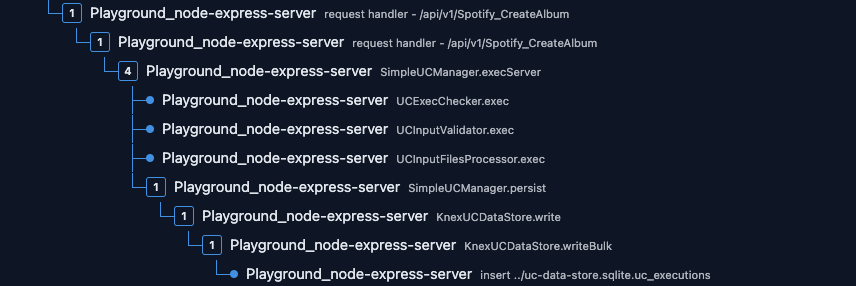
Speaking of libmodulor managers, thanks to the auto-instrumentation, we can see below that we can inspect the whole flow. This is very precious information in order to debug any slow behavior. The checker executing at 27µs should be ok for now.
Conclusion
This is a quick example of how we can add observability to a Node.js server, and when built with libmodulor, get additional "business oriented" traces out of the box.
This has been released in libmodulor 0.31.0, check it out.